Adventure into Spring.
Re-engaging komoot’s community after winter.
In early 2024, komoot introduced streaks, a feature that encourages users to get outdoors once a week and build momentum with weekly activity. On top of being a new feature, it was the centerpiece of a multi-week spring campaign aimed at re-engaging users who had gone quiet over the winter.
As brand designer, I worked with growth product designers, copy and UX writers, to bring this idea to life across product, email and social media. The result was a fresh, spring-themed narrative that felt motivating, approachable, and distinctly komoot.
The challenge: How to re-engage users who stop exploring in winter and get them back outdoors in spring?
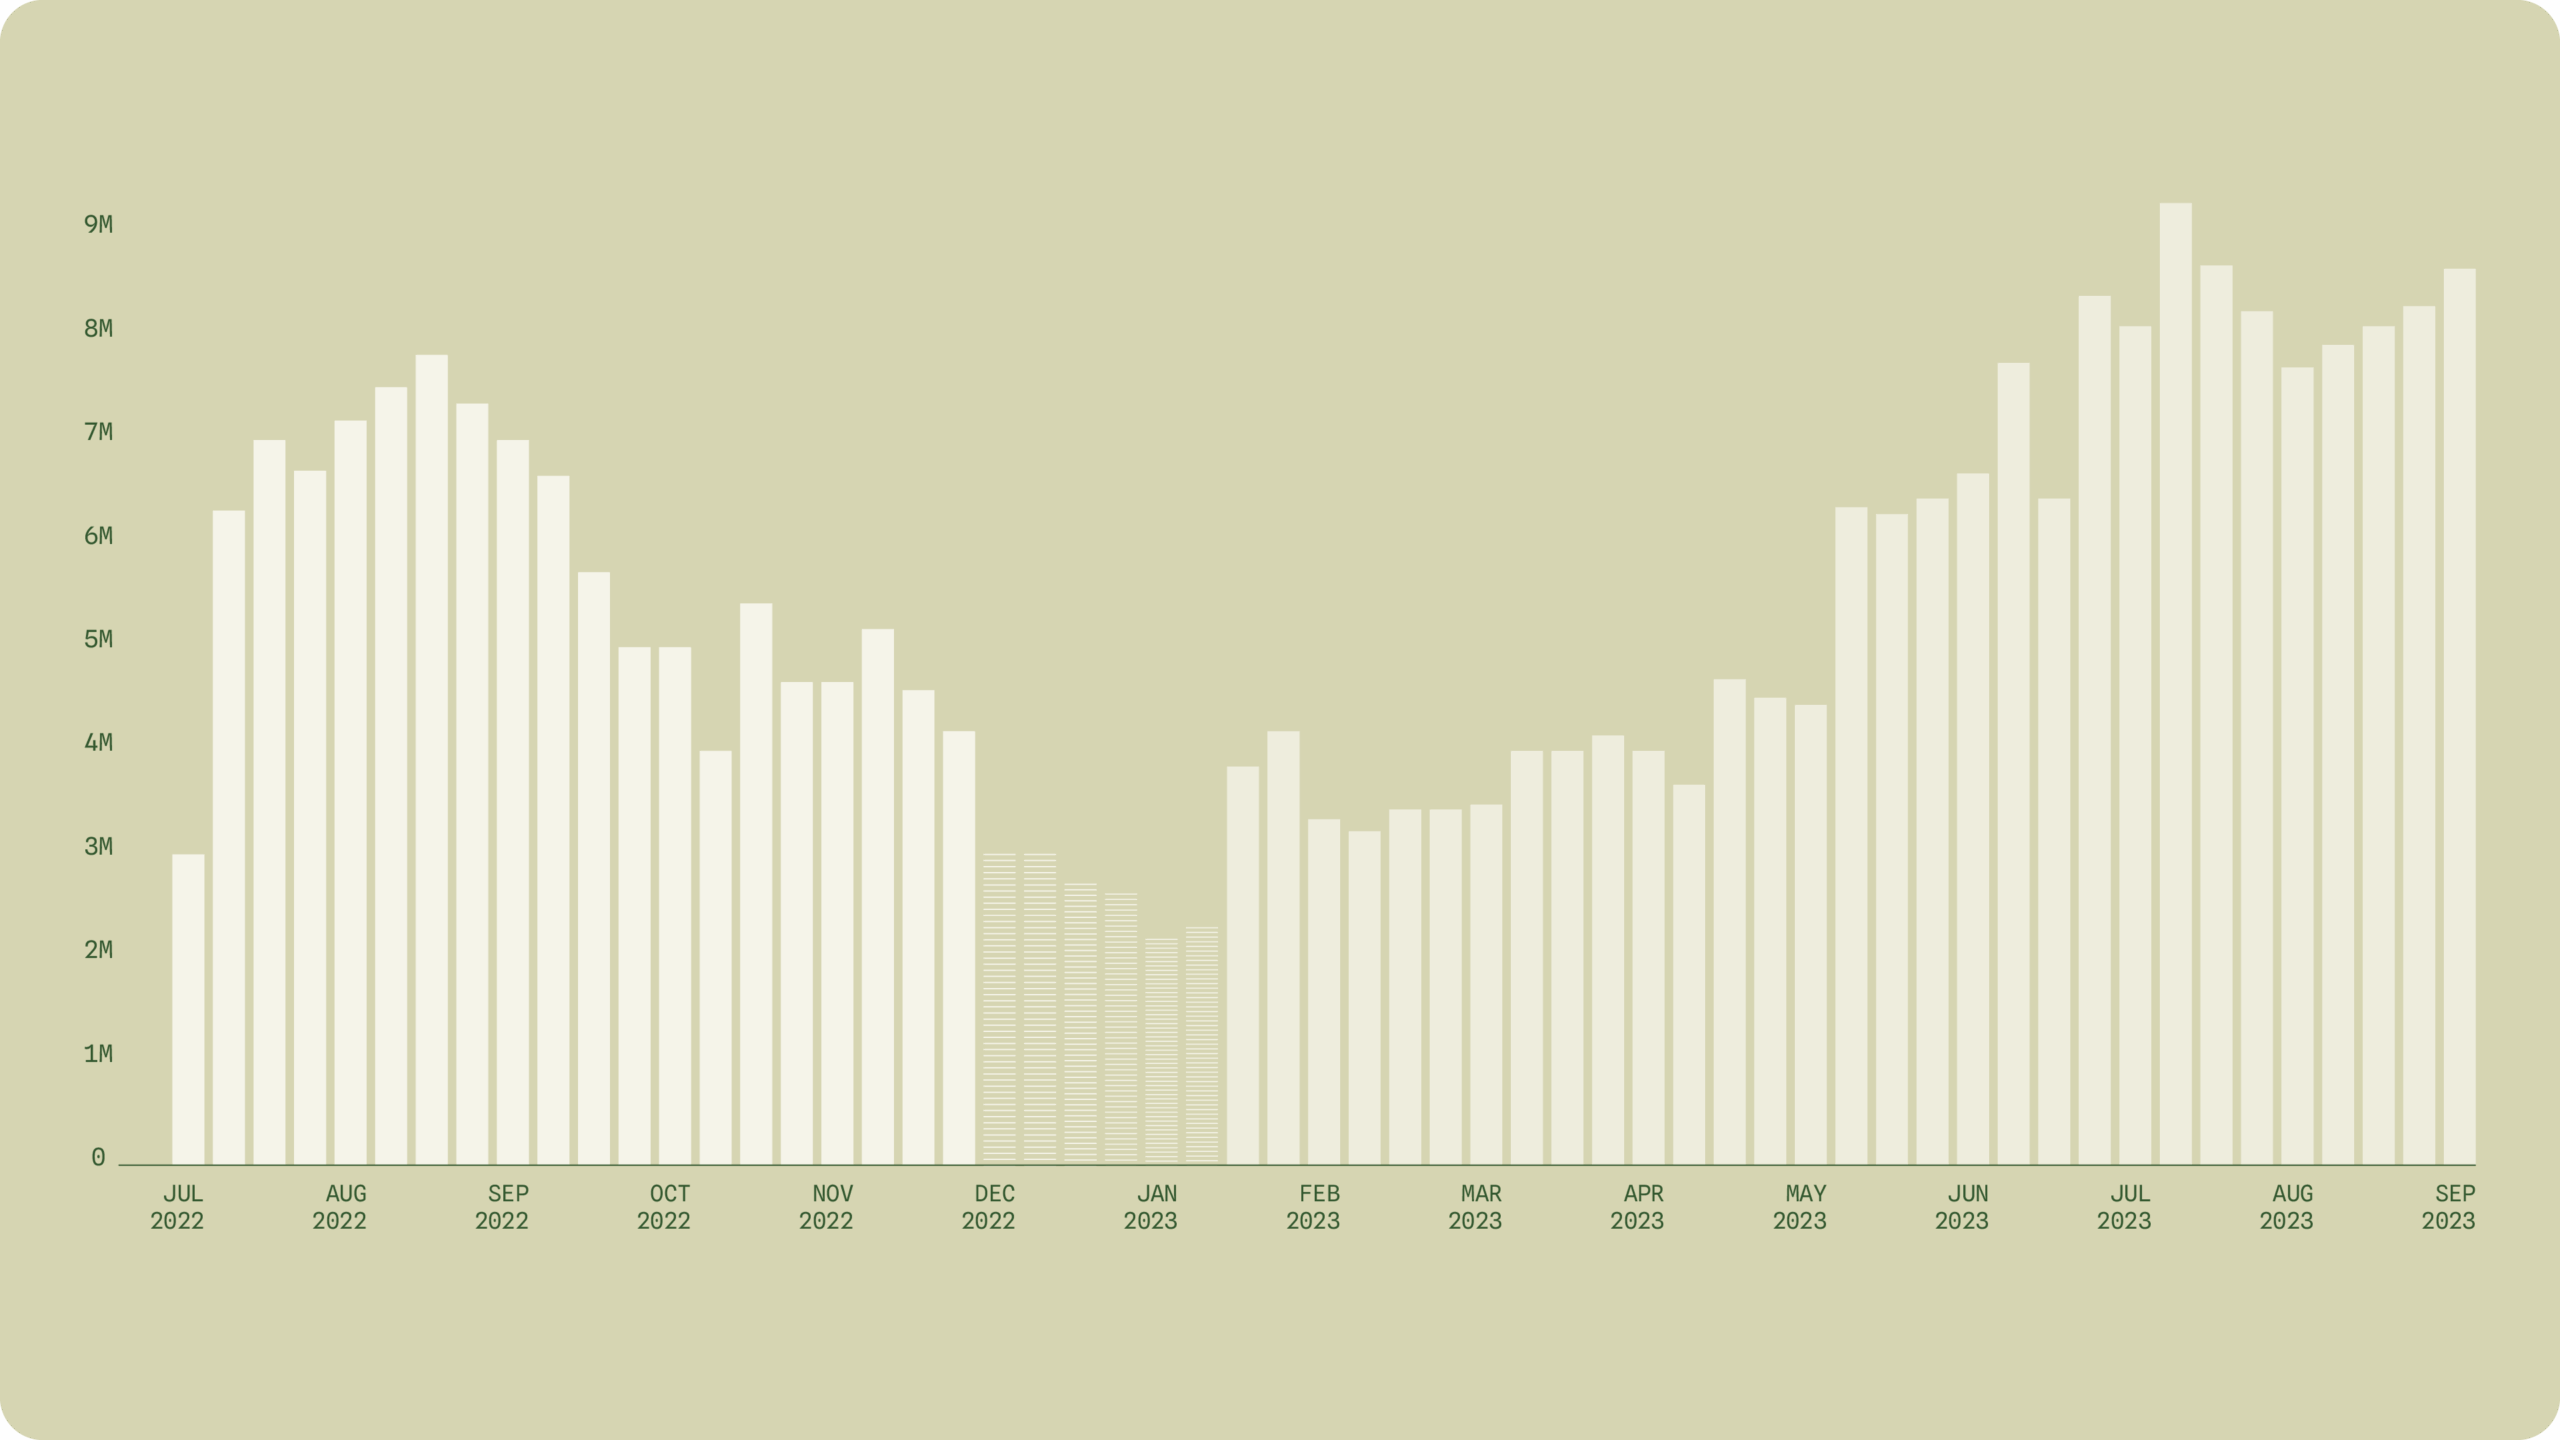
Almost half of komoot active users don’t explore during the colder months of the year but become active again in spring.
Another key factor was the sharp drop in activity among new users on their first year after signup. Returning active users fell by 55% in 2021 and 45% in 2022. Without a spring strategy, we risked losing 450k of the 2023 new active users. It became clear that a narrative was needed to nudge outdoor enthusiasts out of hibernation, reigniting their passion for exploring while reminding them of all the cool features komoot has to offer.
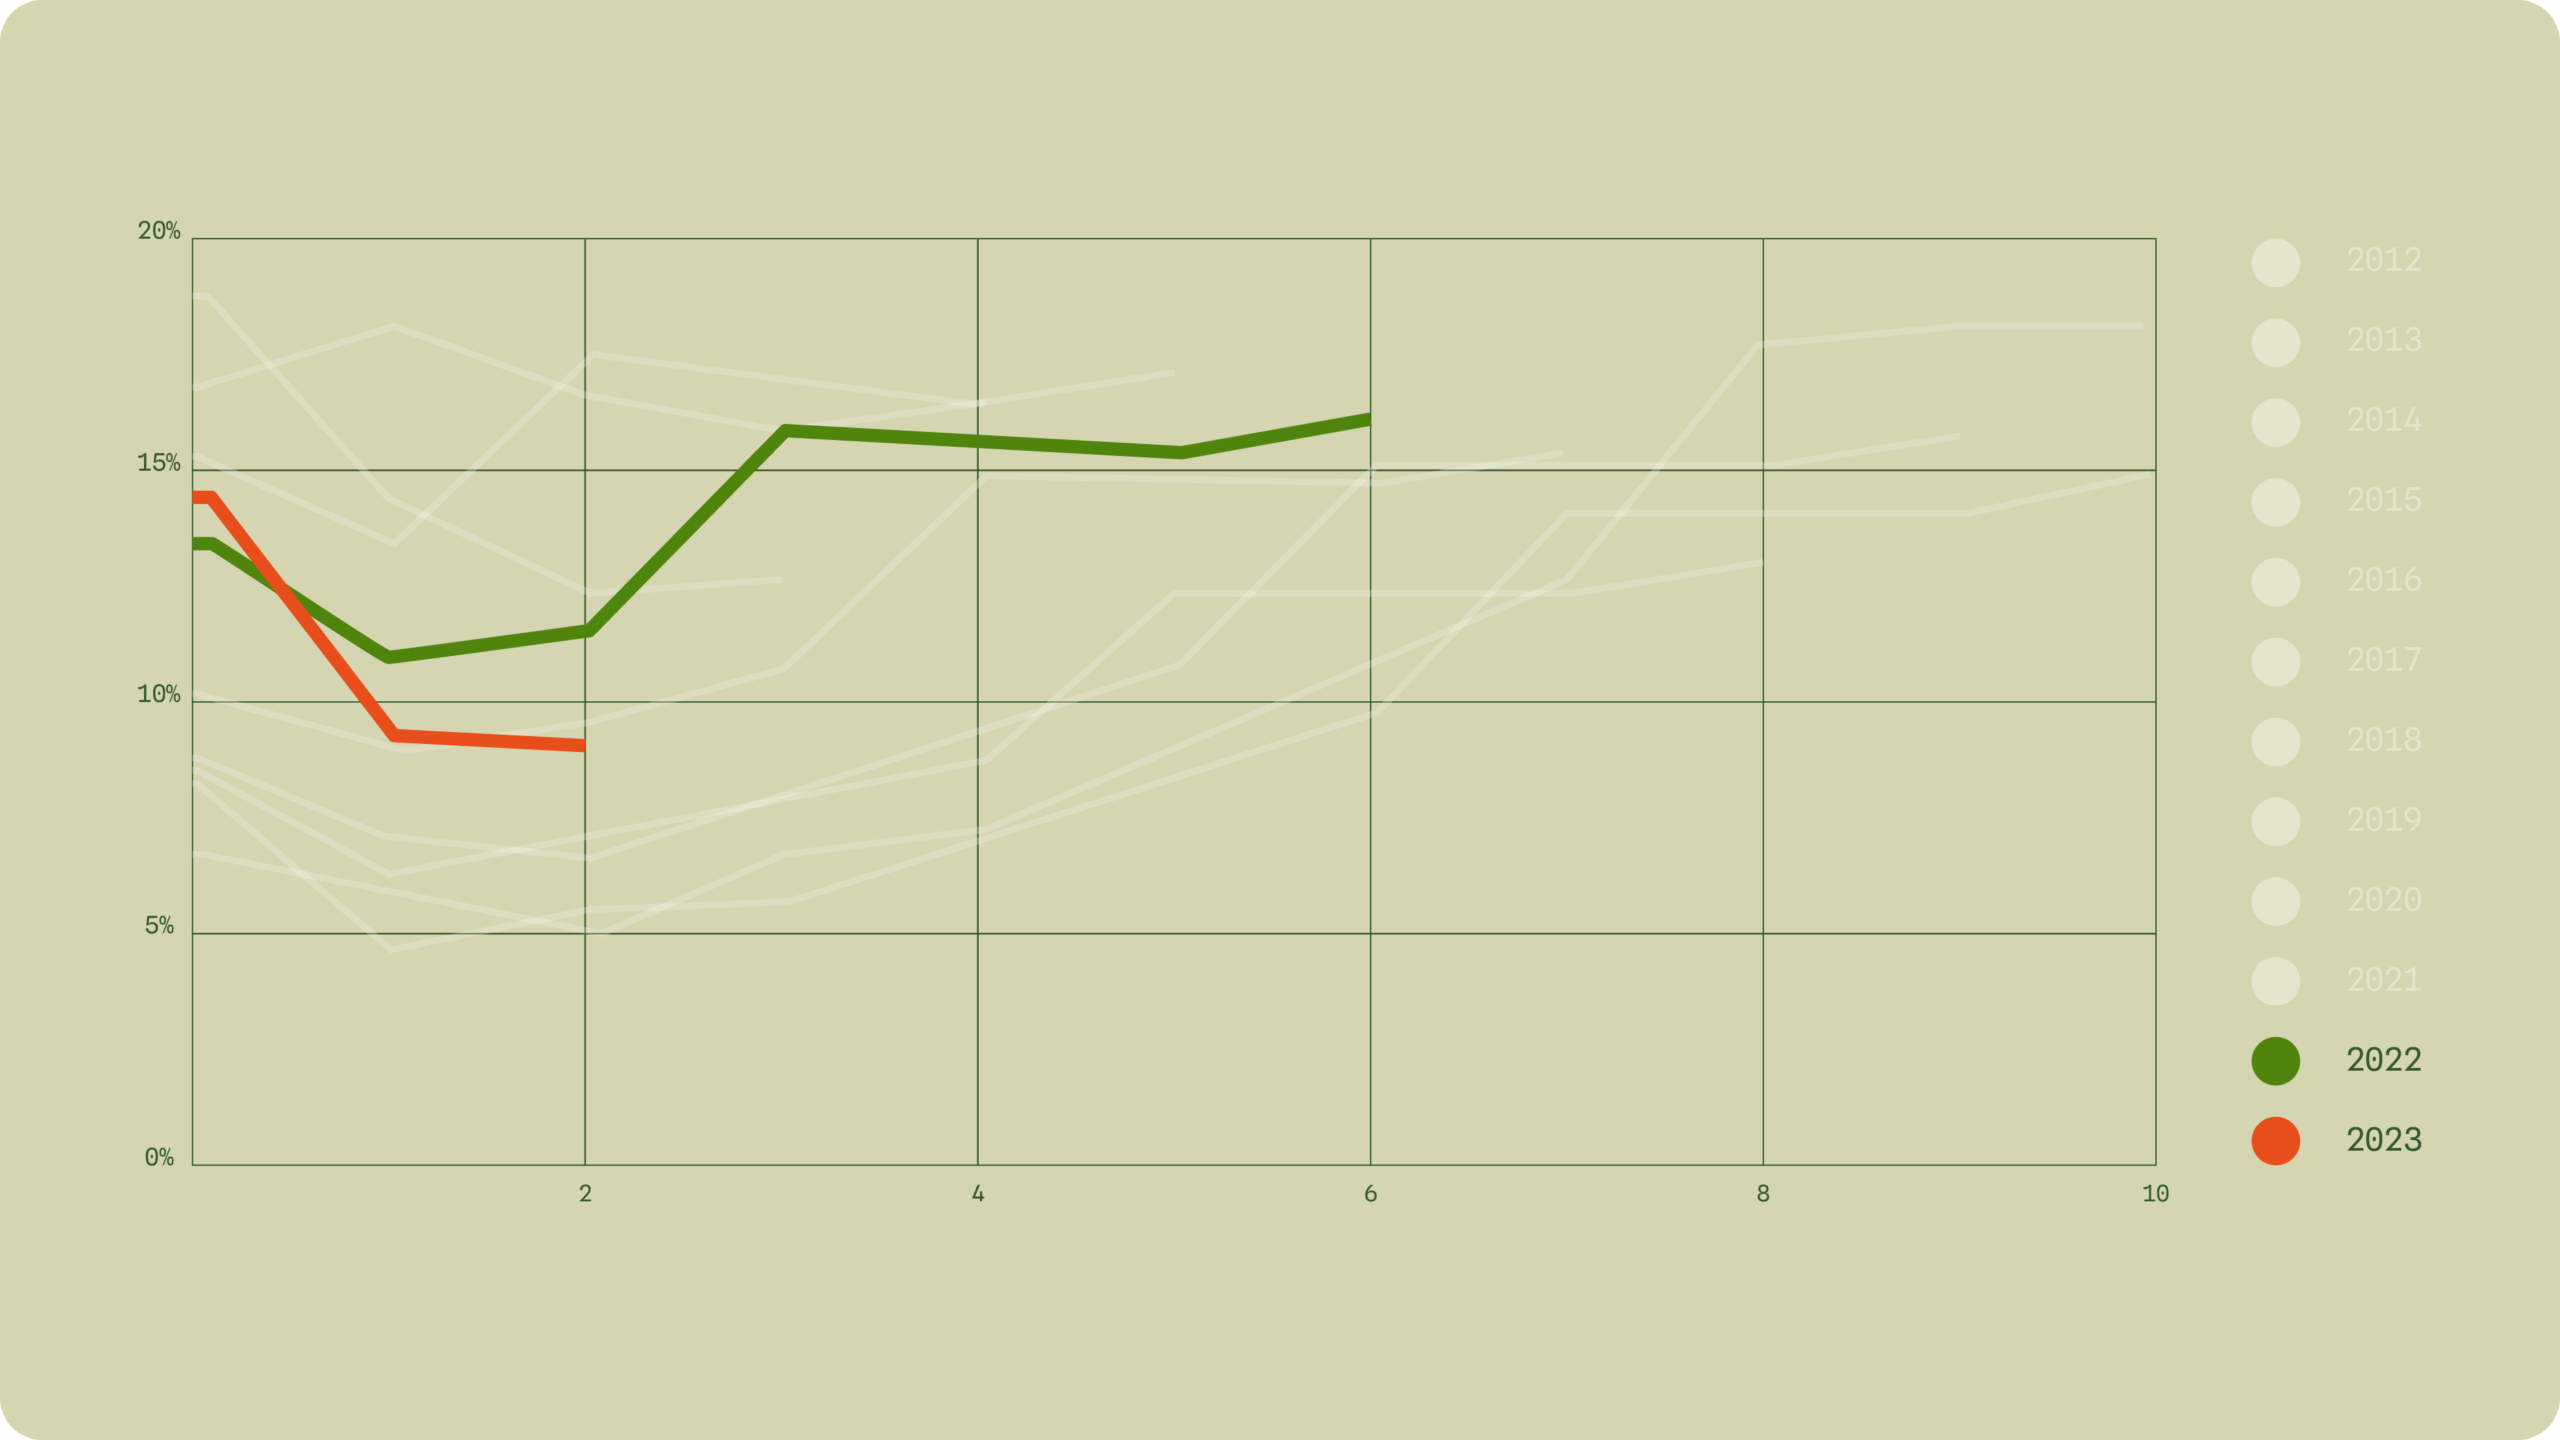
On the X axis, years after signup. On the Y axis, % of active users in Q2/Q3 in 2022 and 2023
User motivation: Finding out what drives people to go outside in order to shape the campaign narrative.
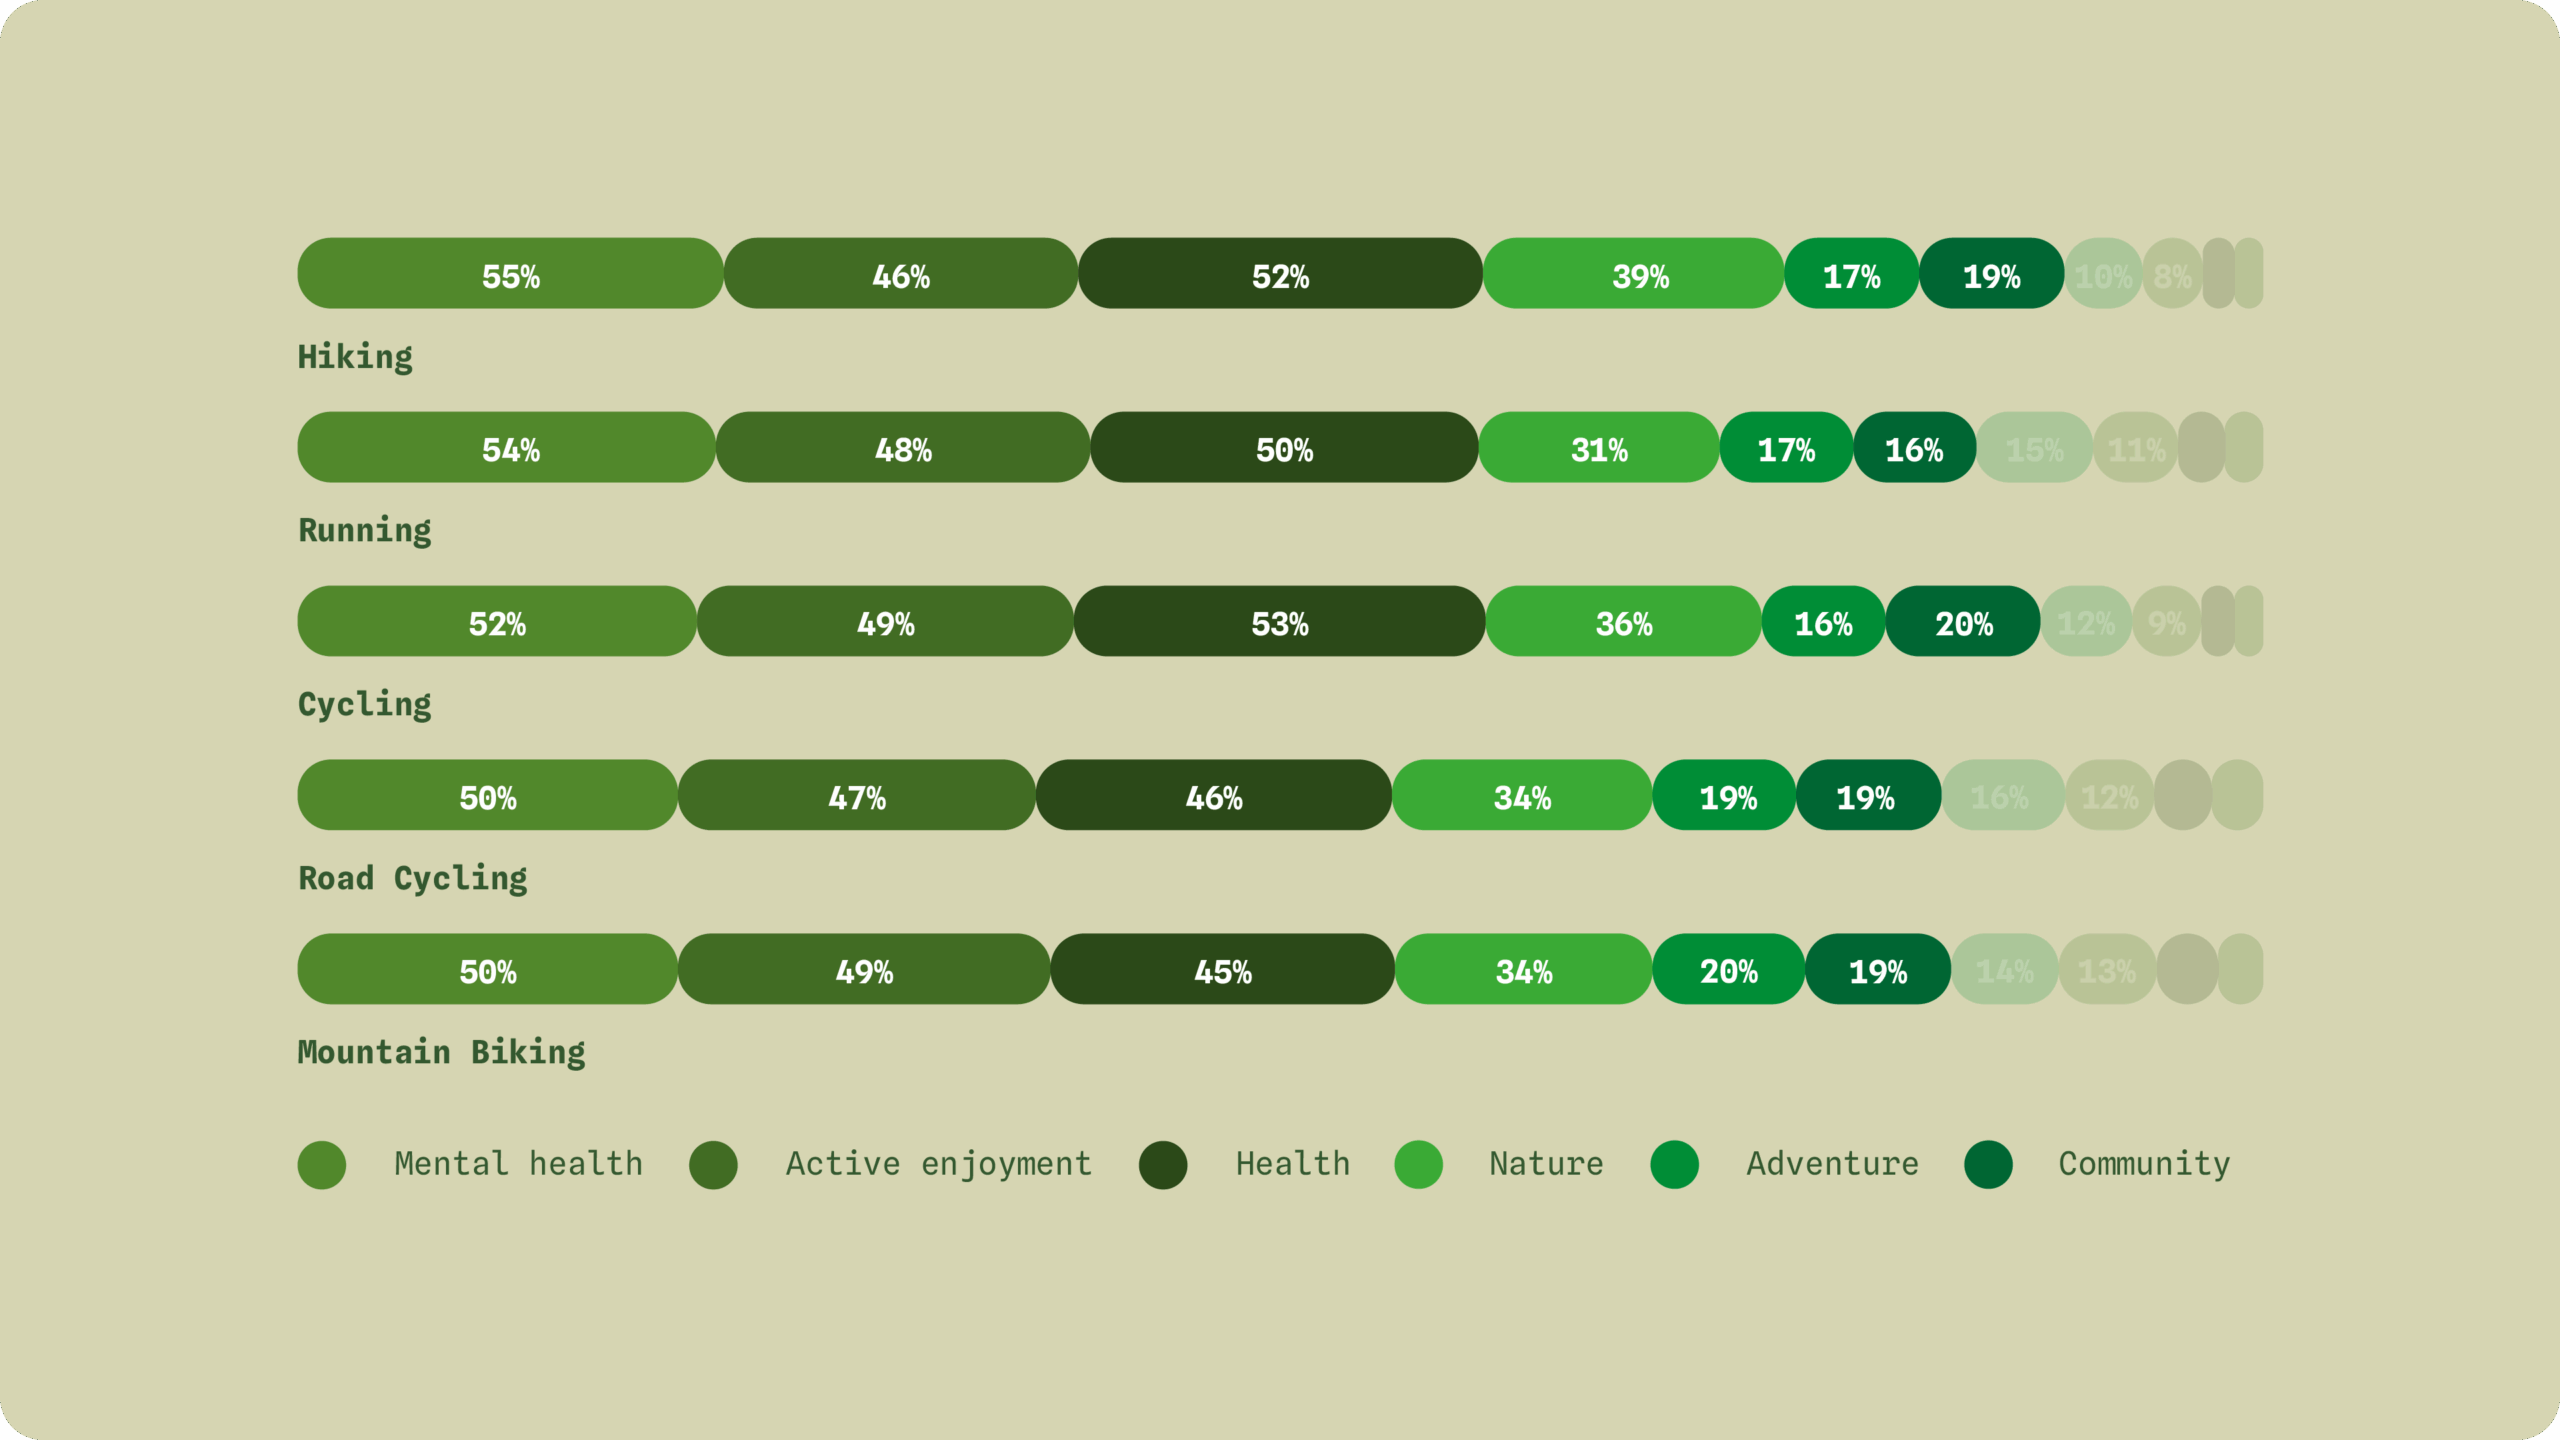
The main sources of motivation for people to go outside. These categories were used to craft the themes of the campaign. Source: Quantilope brand study.
Designing a look and feel to support the campaign narrative.
Based on insights about our users, the feature mechanics, and the defined campaign narrative, I designed a visual language that was applied across the product, email communications, and social media. Every element, from colors and typography to imagery and composition, was carefully chosen to capture the spirit of adventure and encourage users to go outside.
The first step was to design a series of elements representing each week's theme. Using the shape of the streak counter as a reference, I developed four visual elements that embodied the topics selected for the campaign narrative: nature, mindfulness, landmarks, and snacks.
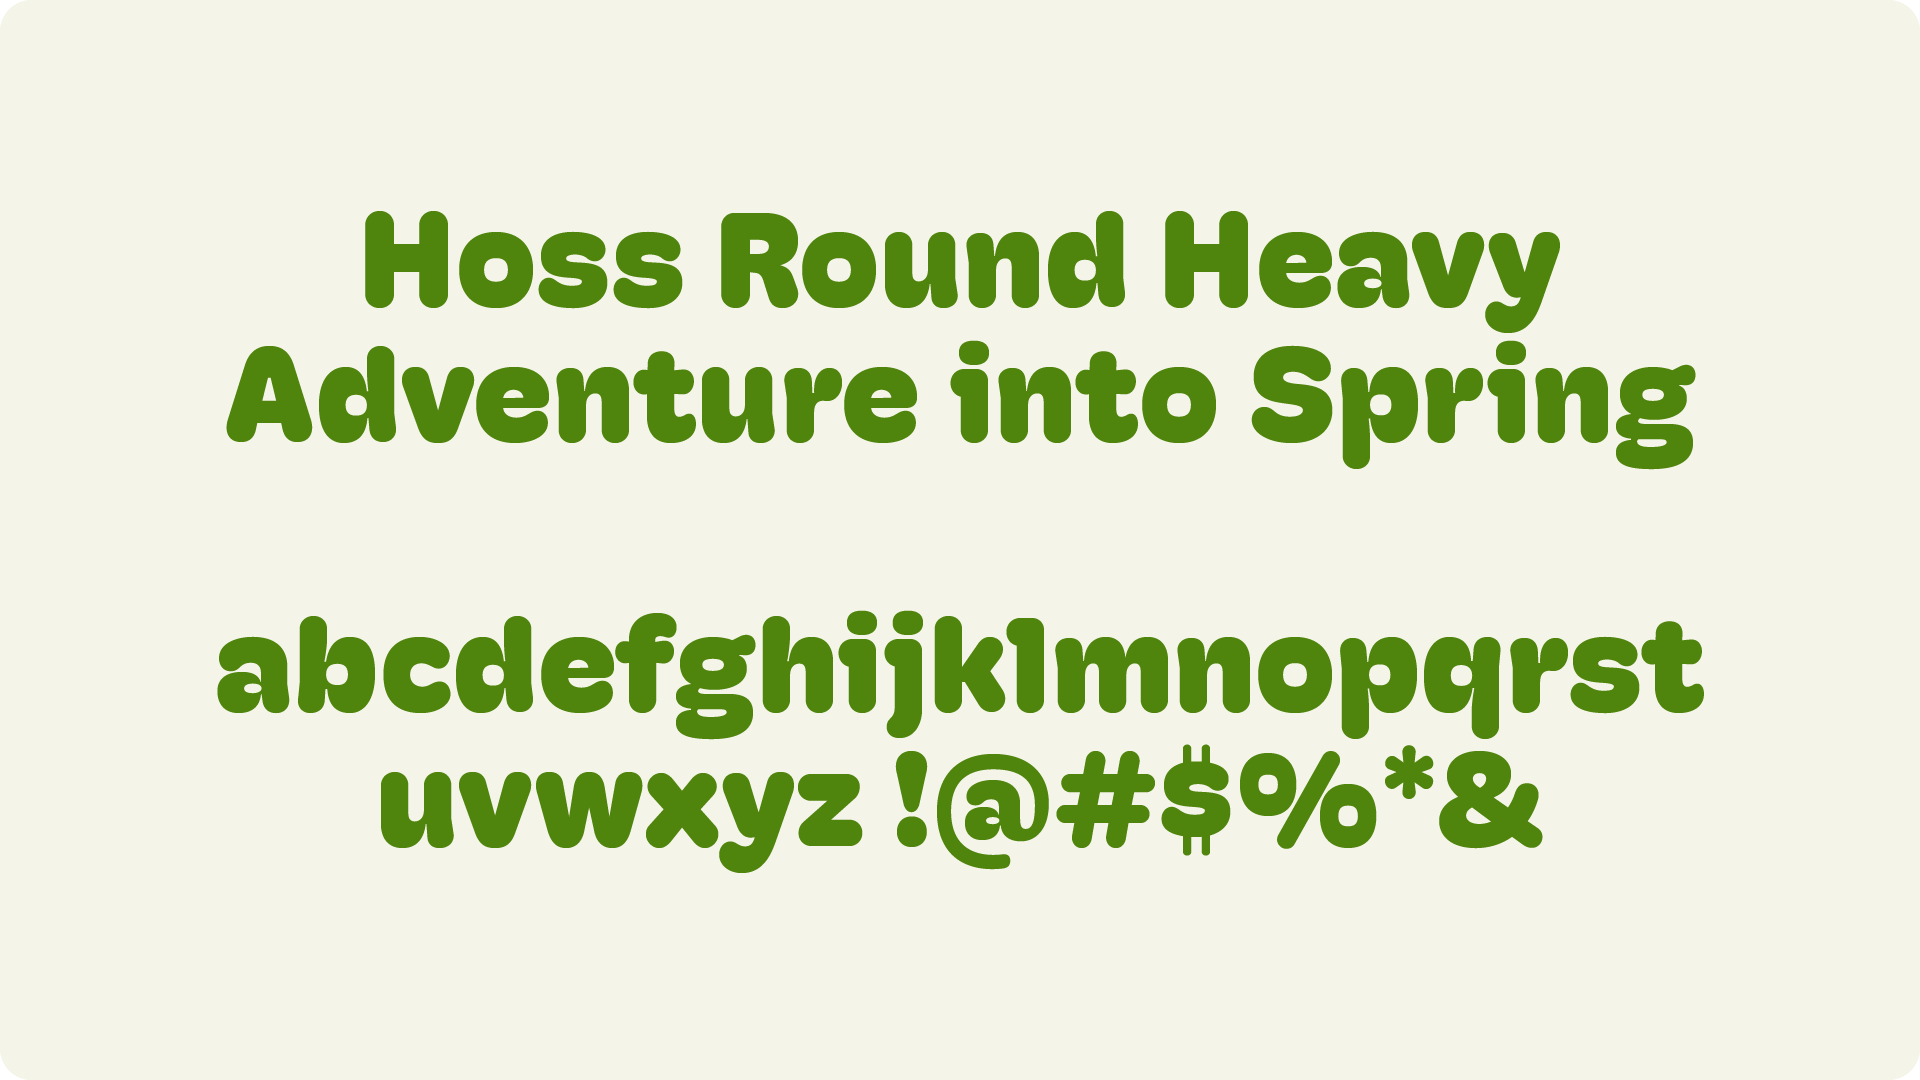
After defining these basic shapes, I looked for a font that would complement them. Given their rounded and playful character, I chose the heavy variant of Hoss Round, a friendly-looking font with soft, rounded curves that feels approachable despite its bold weight.
The final step was to select suitable imagery to complete the visual language. Based on each weekly theme, I chose images that felt uplifting, dynamic, and aligned with the spirit of exploration the campaign aimed to inspire. Careful attention was given to ensuring the imagery worked within the compositions and across different touchpoints, such as emails and the app.
Combined with the pictograms and the chosen font, the result is a unique set of visuals, designed to encourage user exploration and effectively support the communication of the product feature.
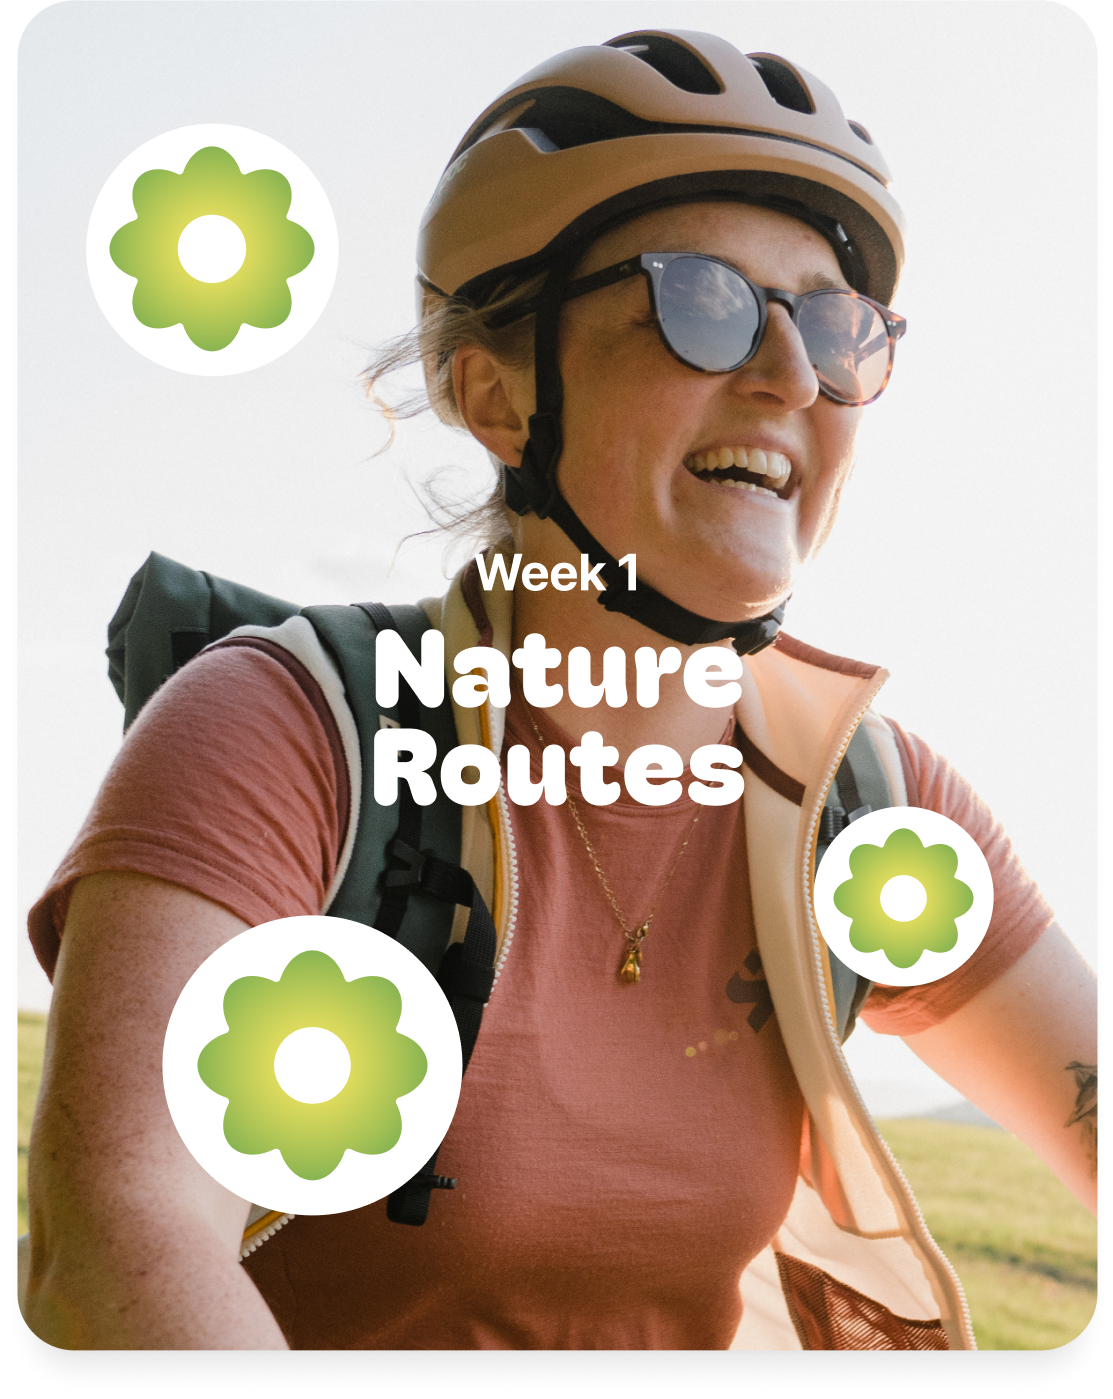
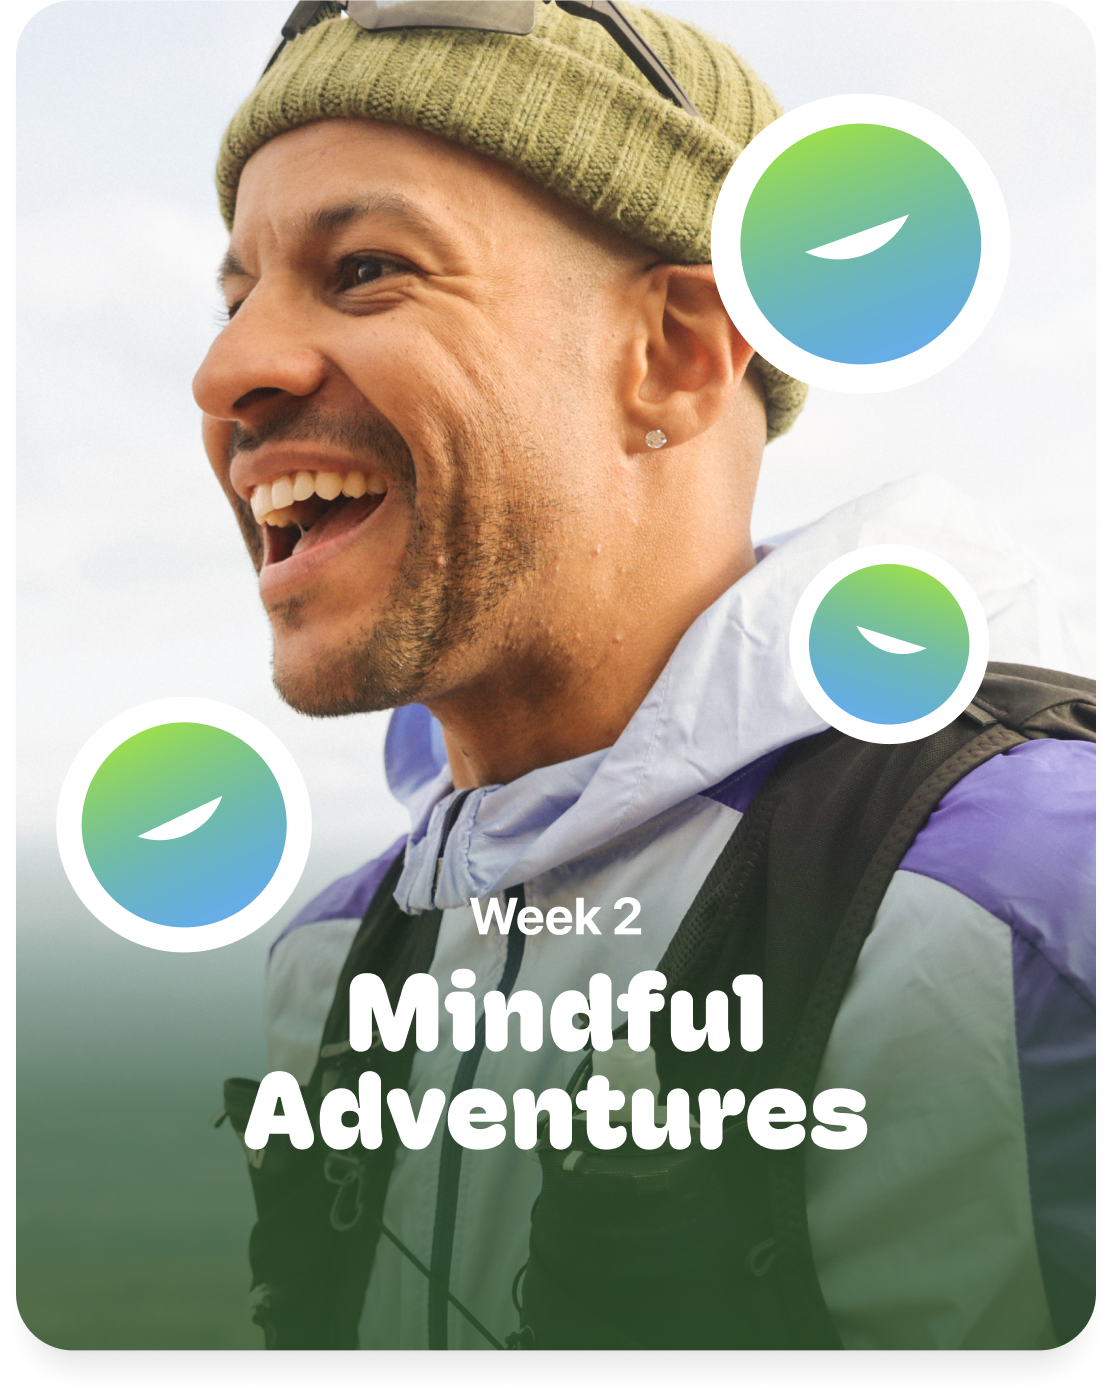
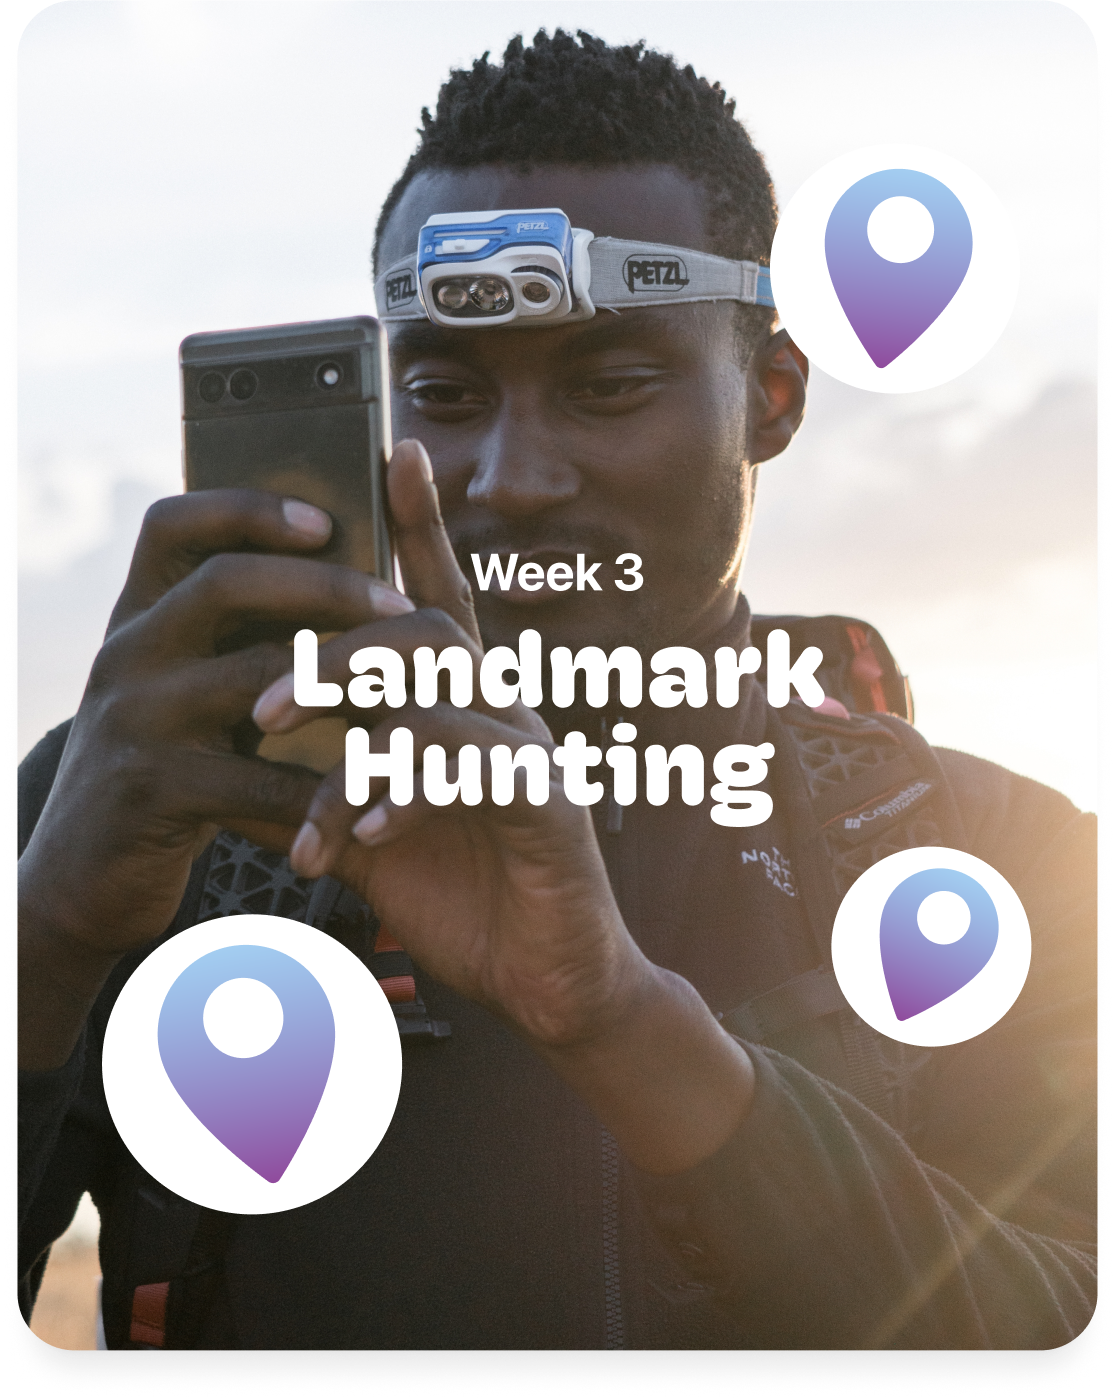
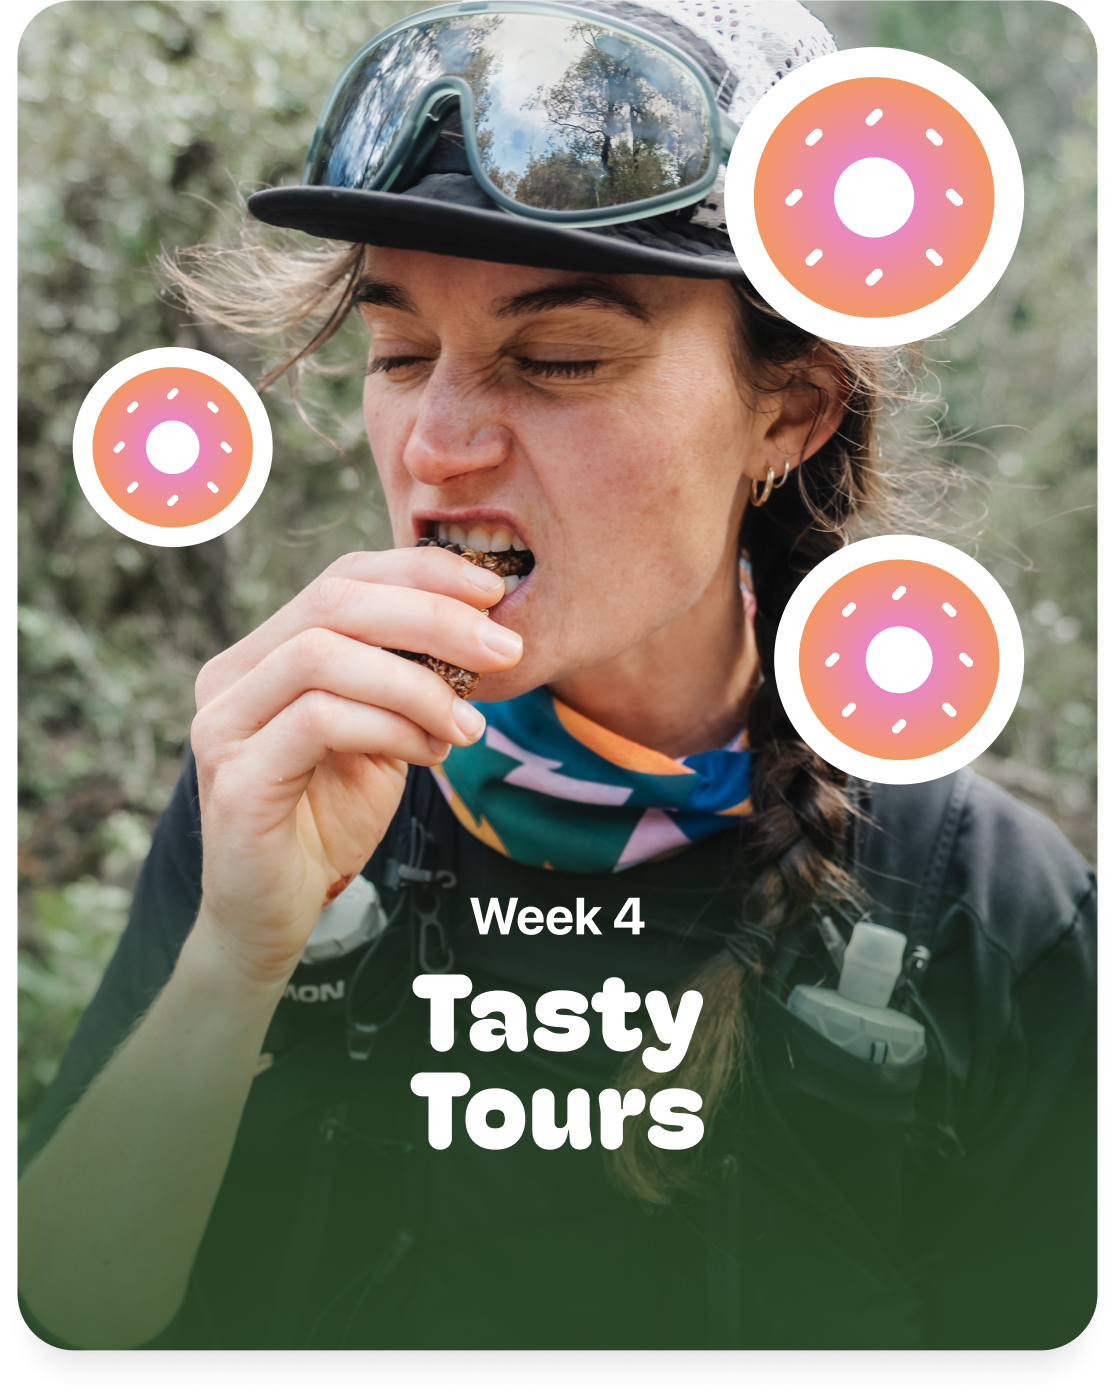
Putting Everything Together: Implementing the campaign visuals across the product, emails, and social media.
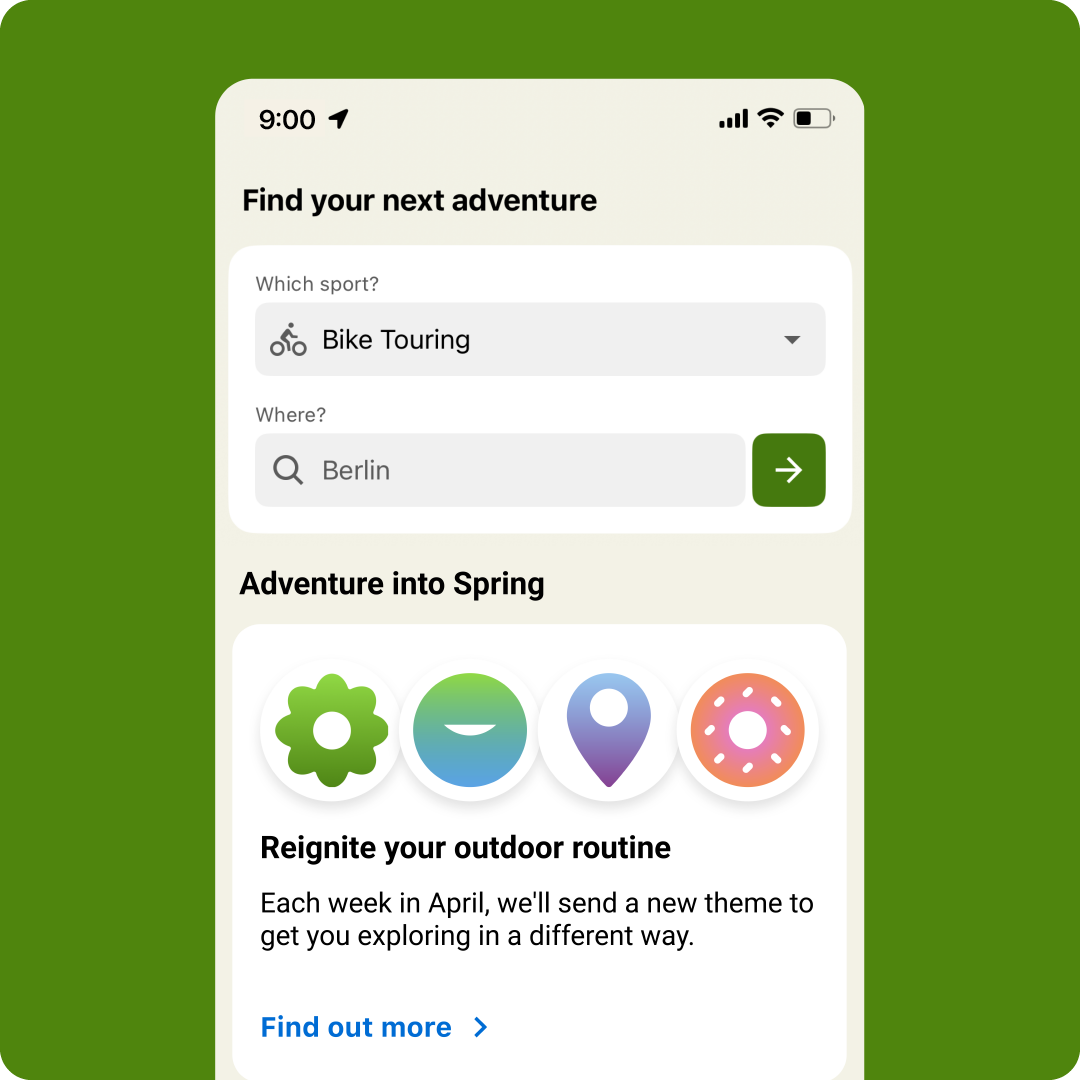
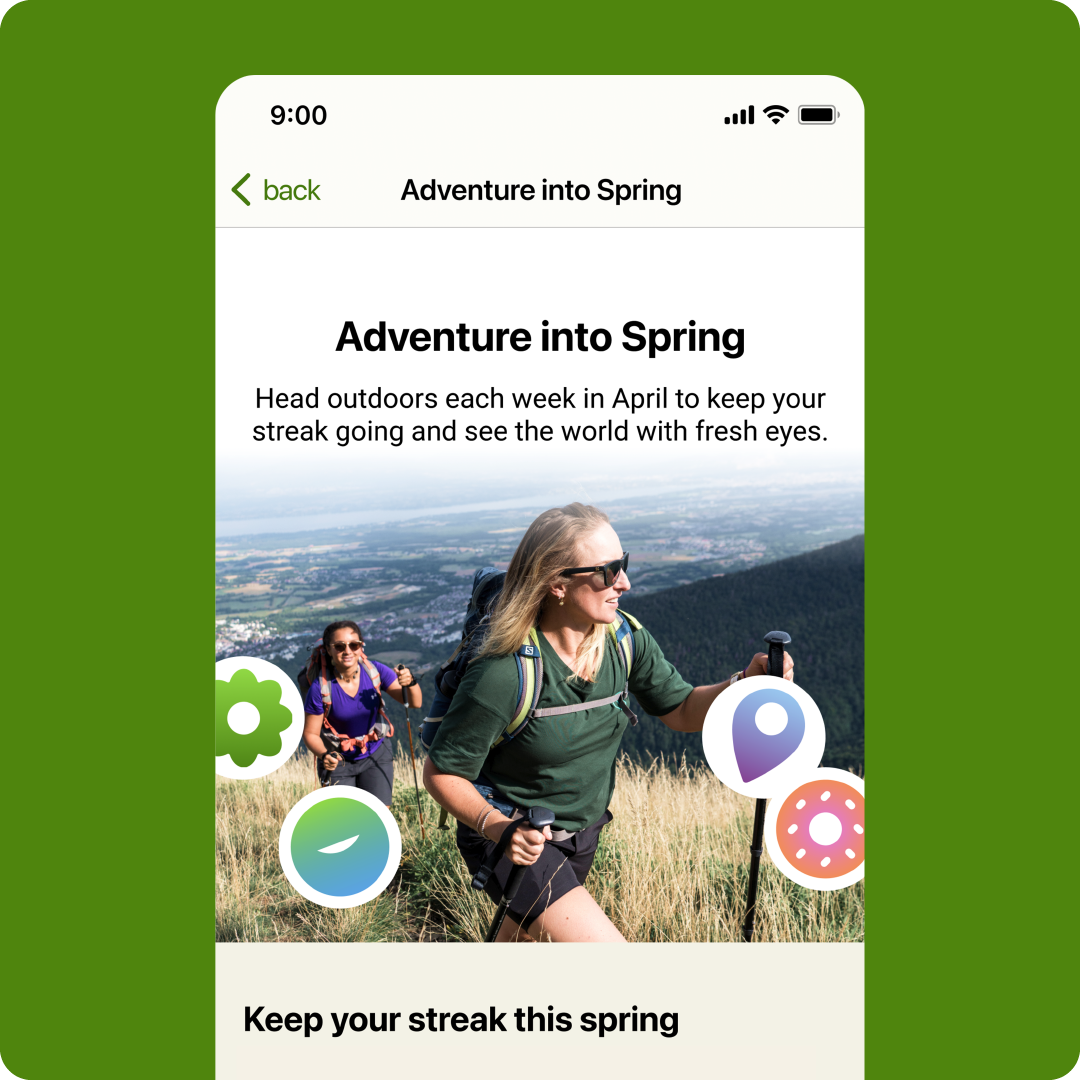
In the weeks leading up to the campaign launch, a widget was placed on the app’s home feed. After tapping it, users would land on a web view that explained the mechanics of the campaign.
Once the campaign was live, the widget was updated weekly to display the week number, the theme, and the accumulated time the user had spent exploring during April. This basic information helped users become accustomed to the functionality of the feature.
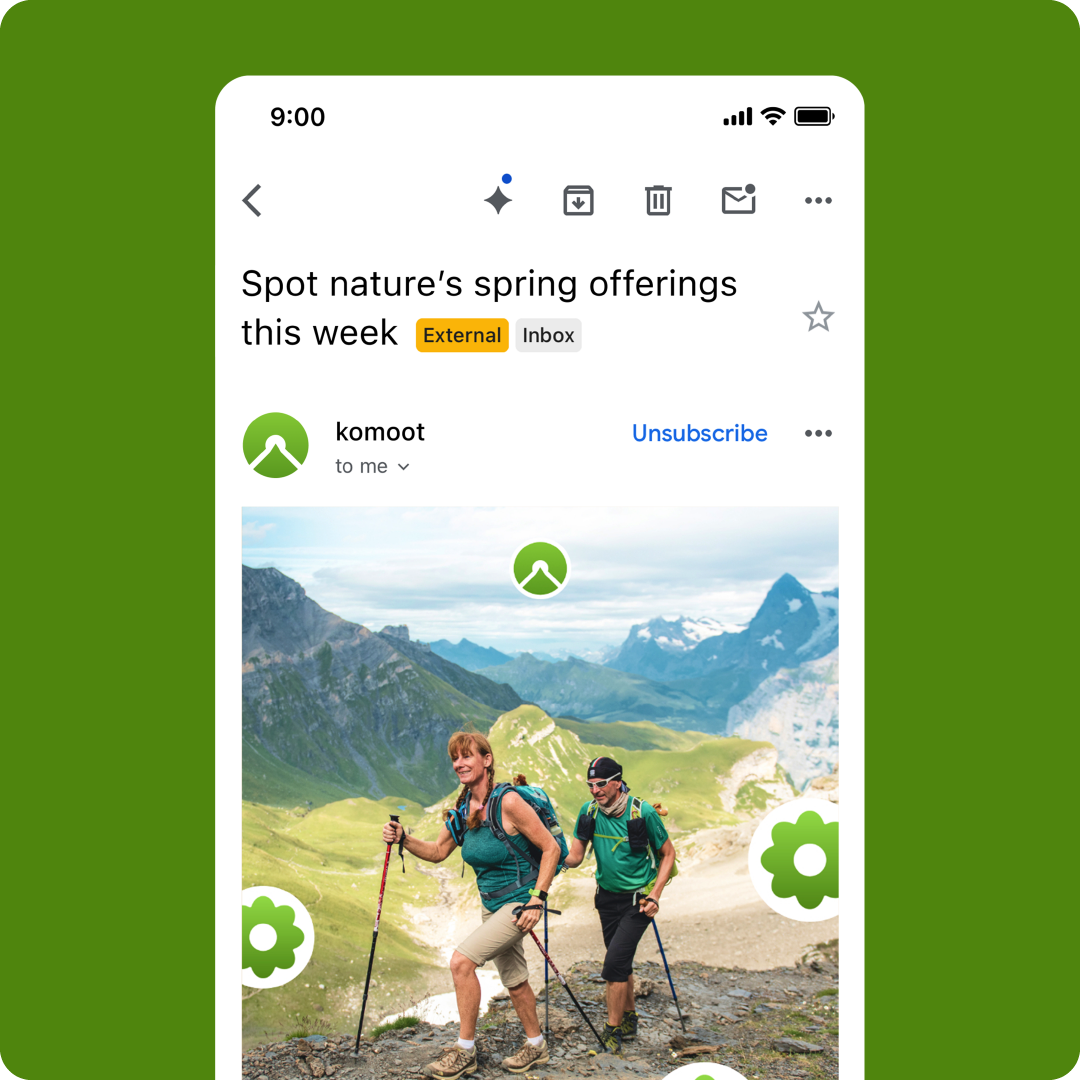
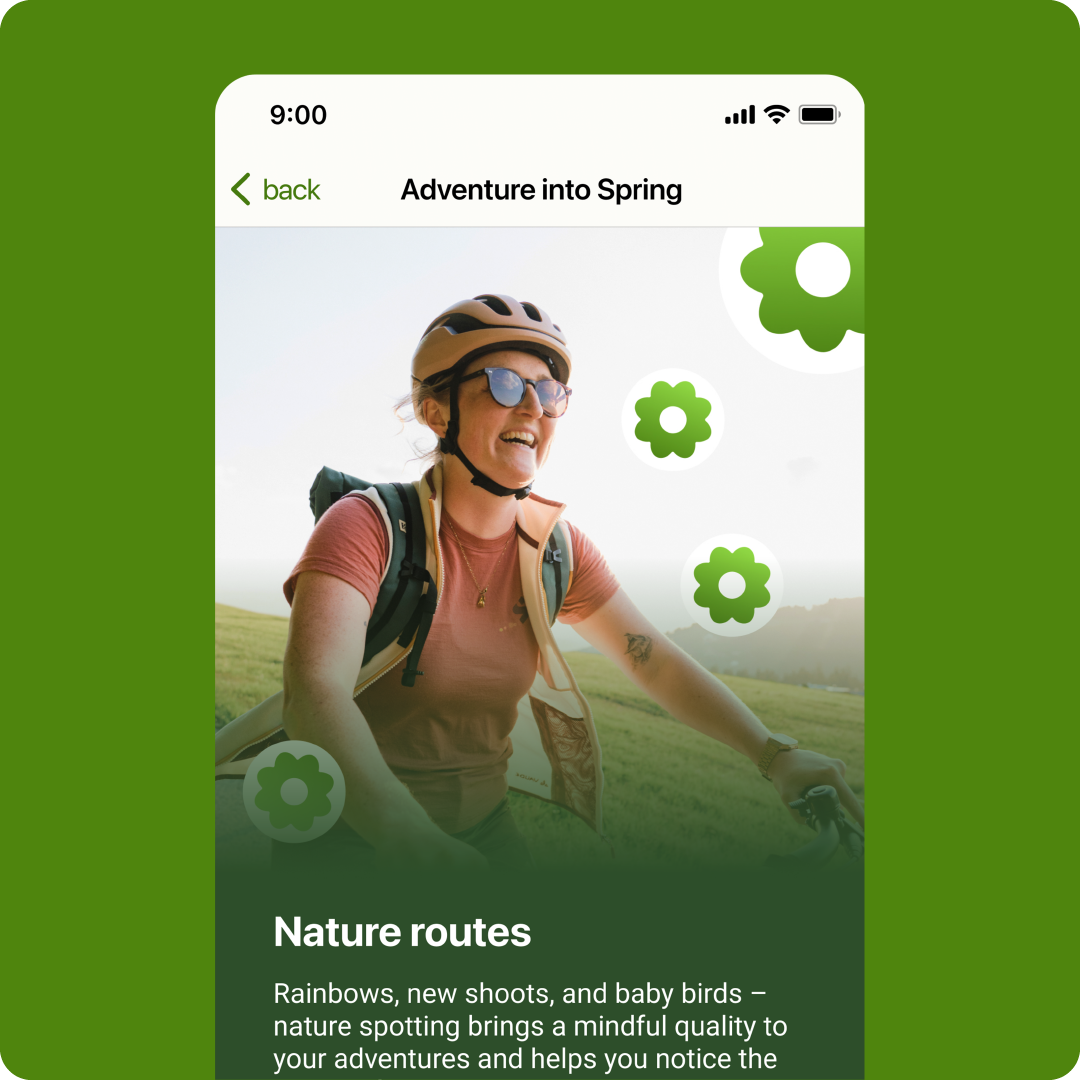
During the entire month of April, users received a weekly email with inspiration based on the campaign themes. Each email communicated the goal of the week, combined with useful information and a brief reminder of the feature's mechanics.
The campaign managed to increase the number of users who went exploring by 10.7%, reaching 2.68 million active explorers during the month of April 2024, compared to 2.42 million in 2023.
